Verified figures on business formation, employment, and lending — pulled directly from the SBA Office of Advocacy and the Federal Reserve's Small Business Credit Survey. Where a figure couldn't be independently confirmed, we left it out rather than guess.
☕ About 6 min read
Written by
Marcus Ellington, BCC Supplies Editorial Team
· Last updated July 10, 2026
Quick Answer
About 36.2 million small businesses (36,207,130) operate in the U.S., employing 62.3 million people — 45.9% of all private-sector workers, according to the SBA Office of Advocacy's 2026 release. The Federal Reserve's Small Business Credit Survey found that 42% of financing applicants received the full amount they sought, and that 60% of firms borrowing from online lenders reported higher-than-expected costs, versus 37% at small banks and 32% at large banks. Figures we could not confirm against a primary source, such as the share of non-employer firms, are left out rather than guessed.
⚖️ The Verdict
✓36,207,130 small businesses currently operate in the U.S., employing 62.3 million people — 45.9% of all private-sector workers. Confirmed directly against the SBA Office of Advocacy's own 2026 release.
✓Online lenders are growing fast (17% of financing applicants in 2020, up to 29% in 2025) but come at a real cost: 60% of businesses that borrowed from one reported higher-than-expected costs, versus 37% at small banks and 32% at large banks.
✓"Rising costs" was the single most-cited financial challenge in the Fed's latest survey of small employer firms.
✓Less than half (42%) of financing applicants get the full amount they ask for — a real, measurable funding gap, not just a perception.
✓We found conflicting figures for the share of businesses with no employees (non-employer firms) across multiple sources and are not publishing a number we couldn't resolve.
📊1. The headline numbers
The SBA's Office of Advocacy publishes the most authoritative count of U.S. small businesses. Its 2026 release confirms:
36.2M
Small businesses currently operate in the U.S., employing 62.3 million people — 45.9% of all private-sector workers.
SOURCE: SBA OFFICE OF ADVOCACY, 2026
Metric
Figure
Source
Total U.S. small businesses
36,207,130
SBA Office of Advocacy, 2026
Small business employment
62.3 million
SBA Office of Advocacy, 2026
Share of private-sector employment
45.9%
SBA Office of Advocacy, 2026
Small business share of GDP
43.5%
SBA Office of Advocacy, 2026
A small business, for the SBA's research purposes, is generally defined as an independent business with fewer than 500 employees — a broad definition covering everything from solo consultants to established regional employers.
🏦2. What does the 2025 Small Business Credit Survey show?
The Federal Reserve's 2025 Small Business Credit Survey (SBCS) — fielded September to November 2025 across 6,525 small employer firms, released March 2026 — is the most current, authoritative look at how small businesses actually borrow.
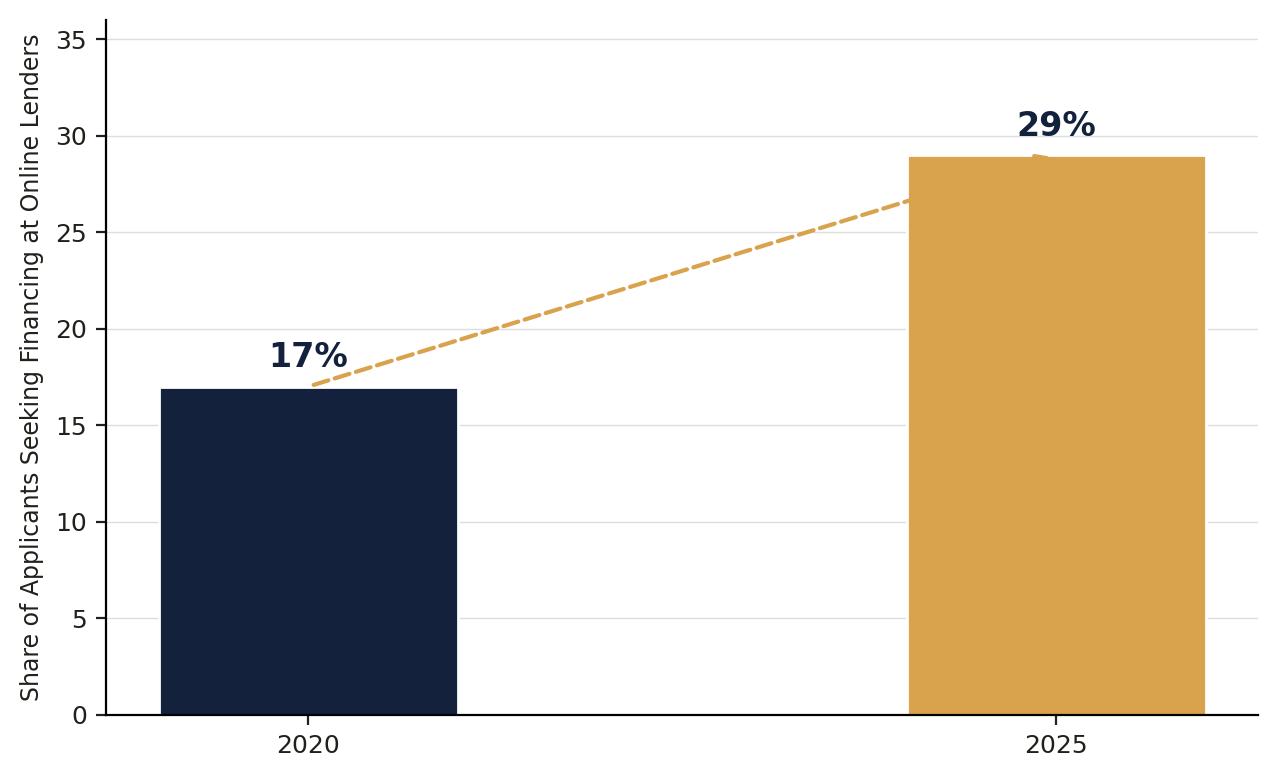
Share of financing applicants seeking funding at online lenders, 2020 vs. 2025. Source: Federal Reserve SBCS.
The share of small businesses applying for financing at online fintech lenders has grown every year for five consecutive survey cycles — from 17% of applicants in 2020 to 29% in 2025. But that convenience carries a real, measured cost:
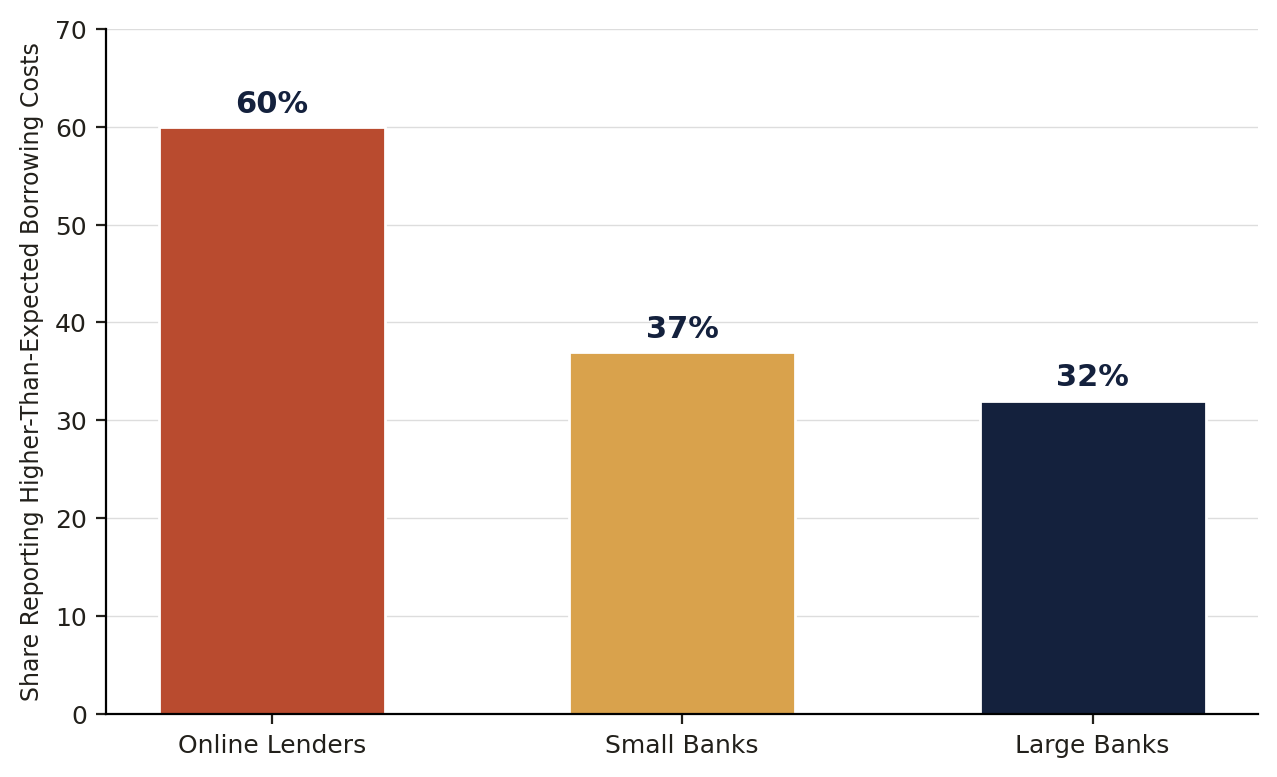
Share of borrowers reporting higher-than-expected borrowing costs, by lender type. Source: Federal Reserve SBCS 2026.
60% of firms that borrowed from an online lender reported higher-than-expected borrowing costs — nearly double the rate at small banks (37%) and large banks (32%). Small banks also had the highest full-approval rate among applicants (57%).
Among all financing applicants surveyed, 42% received the full amount they sought, 36% received a partial amount, and 22% received none — a real, persistent gap between what small businesses ask for and what they actually get.
42%
Of small business financing applicants received the full amount they sought — 36% got partial funding, 22% got none.
SOURCE: FEDERAL RESERVE SMALL BUSINESS CREDIT SURVEY, 2026 REPORT
Among firms that sought financing, the two most common reasons were meeting operating expenses (56%) and pursuing expansion or a new opportunity (46%). And consistent with that cost pressure, "rising costs" was the single most-cited financial challenge among respondents in the Fed's 2026 report.
⚠️3. What we left out, and why
Early drafts of this page included additional figures — the share of non-employer (solo) firms, a year-to-date business application total, and a specific women-ownership percentage. We couldn't independently confirm these to our own standard, for different reasons:
Non-employer firm share: we found conflicting figures across multiple sources for what percentage of U.S. small businesses have no employees — estimates we encountered ranged from roughly 81% to over 90%. Rather than publish either number with false confidence, we're leaving this out until we can confirm it directly against the SBA's own current breakdown.
Cumulative year-to-date business applications: we have verified, sourced figures for two individual months in 2026 (see our Business Formation & Credit Policy Tracker), but not a confirmed five-month cumulative total or year-over-year growth rate.
Women-owned business share: we did not find a figure we could confirm against a primary source in the time we spent researching this page.
The data says the market keeps growing. Get funding-ready.
Report a real business installment tradeline — no SSN, no personal guarantee, 0% APR.
Every figure on this page was independently verified against the issuing organization's own current publication — the SBA Office of Advocacy's 2026 small business FAQ release, and the Federal Reserve's 2026 Report on Employer Firms (covering the 2025 SBCS). We do not publish figures sourced only from secondary summaries or AI-generated synthesis without independently confirming them against the primary source ourselves.